Reports
After logging into Auditor’s admin portal, the default-landing page is Reports. All data that is captured using Auditor’s app is seen here. Auditor has the reports function that allows you to filter through data, generate reports and export results as a CSV or PDF file. Reports will only ever display data from active forms that have been filled at least once. As the data set increases in size the report graphs adapt to display the information.
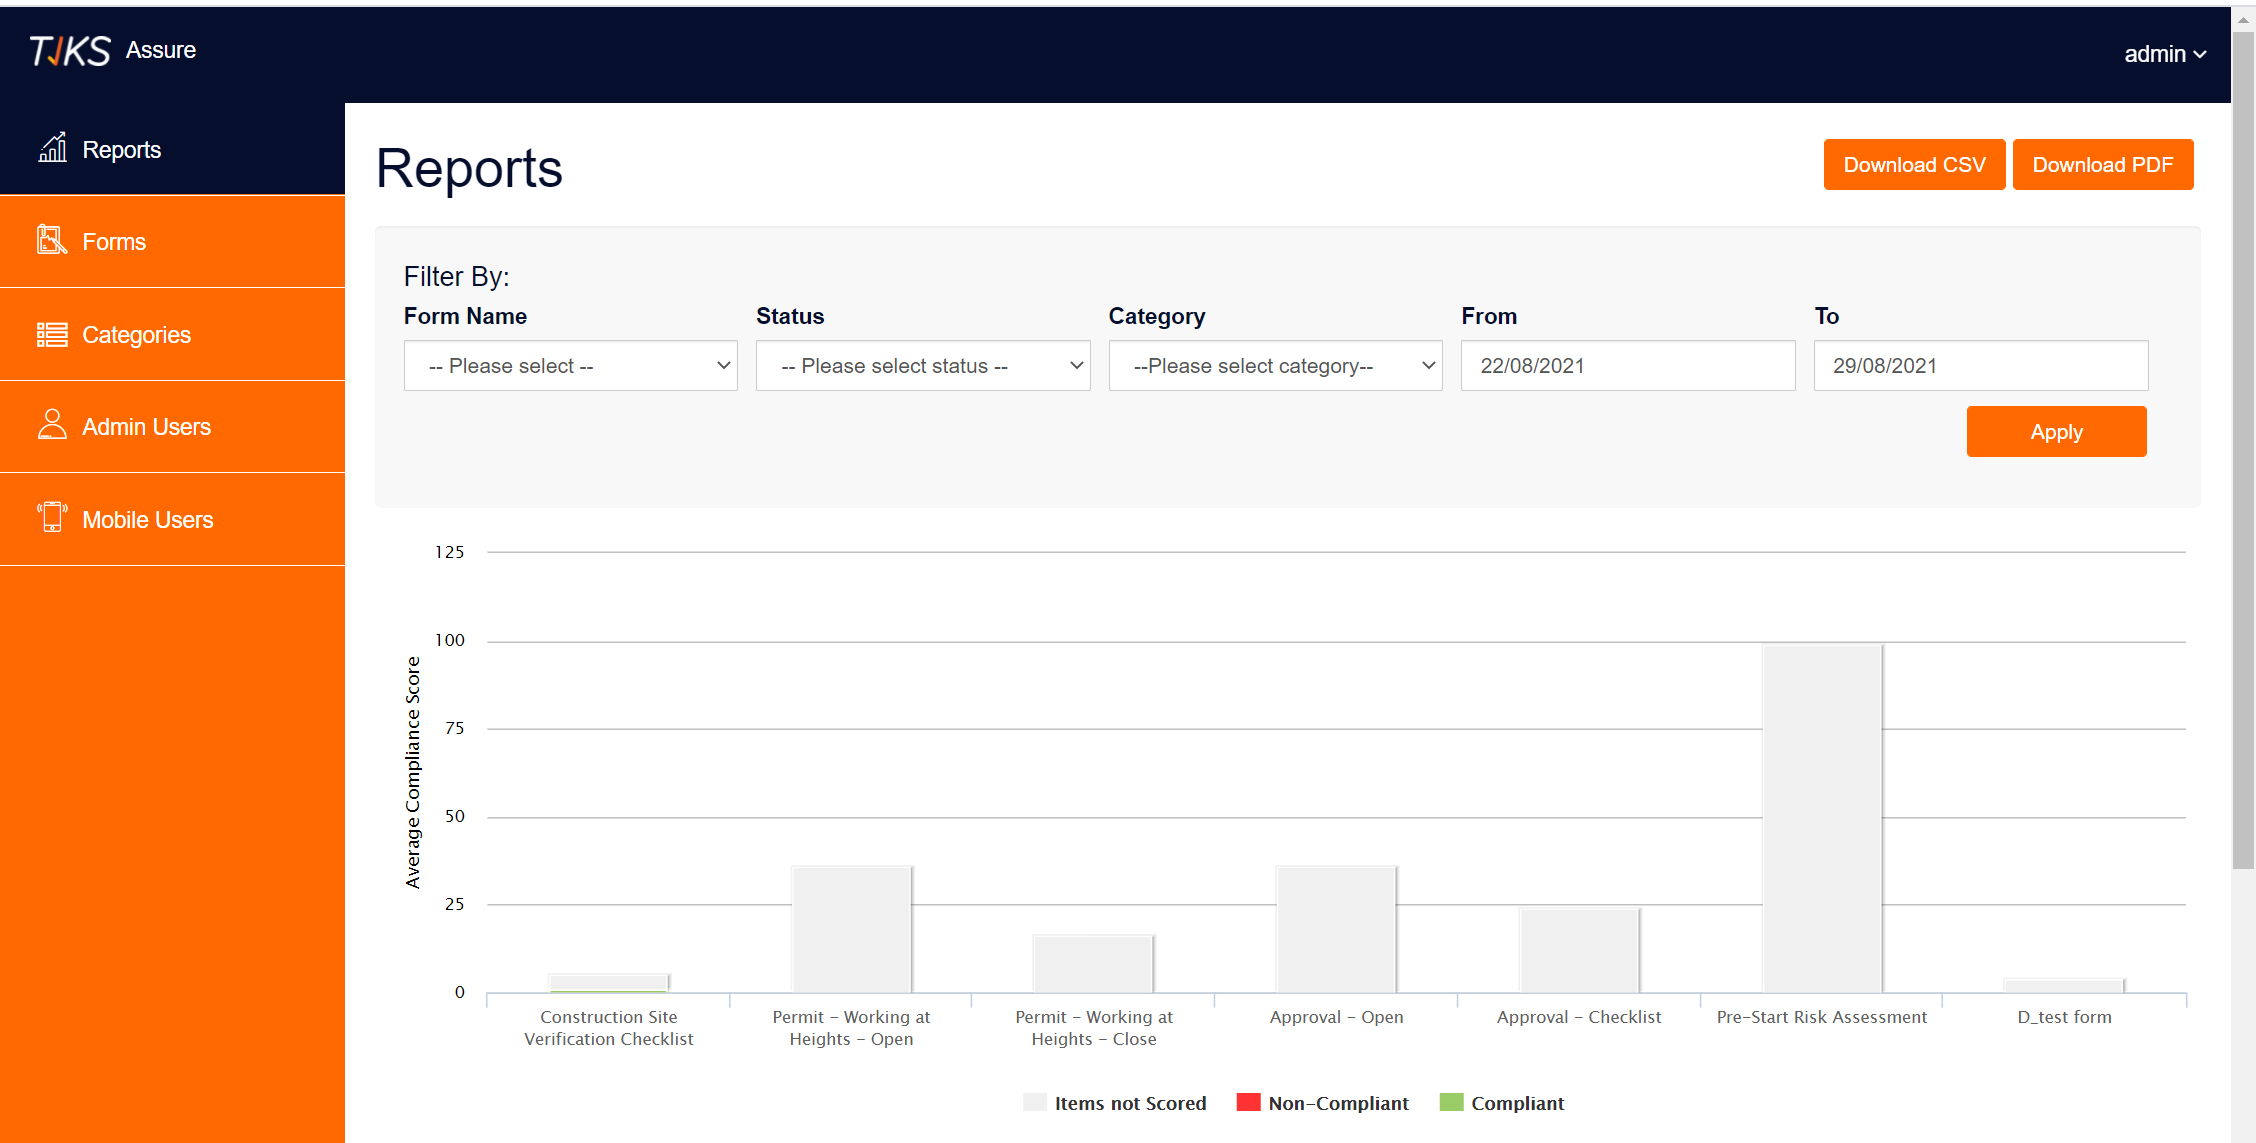
Filter Report Data
To filter report data, simply select your range criteria from the drop down menu and press the blue Apply button to narrow/ refine your search.
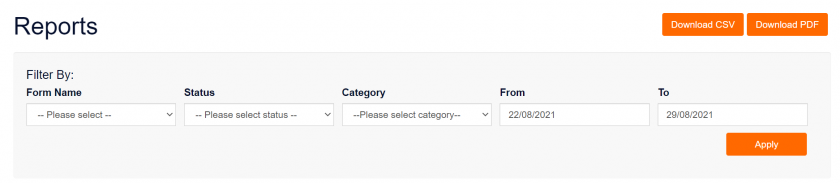
- ‘Filter By’ ranges include Form types and Date range.
- Reports results are displayed as a bar graph.
Reports Graph
Reports graph displays the following values: Not Scored, Non-Compliant and Compliant as a bar graph. Each bar represents an individual form. The Y-axis represents total compliance score; the X-axis represents the name of a form.
The following table indicates score value:
|
Score Value |
Colour Code |
|
Items not scored |
Grey |
|
Non-compliant |
Red |
|
Compliant |
Green |
- Hide/unhide any score by clicking on its corresponding label, doing this will alter the graph too.
- The Report Graph is interactive; when a cursor is hovered over a bar, numeric points will display data within your selected date range.